Scraping the City of Cape Town's high resolution aerial imagery
Introduction
One of the projects I never got off the ground while working at the City of Cape Town was labelling the City’s high resolution aerial imagery for machine learning tasks. The City of Cape Town typically does a flyover of the entire city and produces a high quality, 8cm resolution dataset of the entire muncipal area every 3 years.
These datasets are hosted on an ERDAS APOLLO server, and getting a complete dump of the data was a painful task - I had to drive a 4TB hard drive over to the geomatics department and physically plug it into one of their computers.
I was curious to see whether I could get hold of some of this high resolution imagery as a private individual. Because I’d like this to replicate for any other private individual, I didn’t call in any favours from my internal contacts.
It turns out (and I was quite surprised about this) that it is completely possible to extract the entire dataset via the City’s Open Data Portal, but it required a bit of hacking to get right.
How I did it
Navigating the Open Data Portal
The City’s open data portal is here:
https://odp-cctegis.opendata.arcgis.com/
It’s backed by an ArcGIS server.
If you click on the ‘Imagery’ icon, you’re taken to a page that links to a Document called ‘Raster Imagery’. If you click on that, you’re presented with a list of aerial imagery links, all promisingly suffixed with the term (MapServer). Looking good! Not so fast.
If you click, say Aerial Imagery 2022Jan, you’re taken to what looks like an ESRI web service documentation site. There are all sorts of interesting metadata, like the extent of the spatial layer, the Units, supported image format types etc.
We can even view the layer by clicking the ArcGIS.com Map link.
Unfortunately, that map is just an interactive web app, with no clear way to export or programmatically extract imagery. So, back to the documentation site.
REST hacking
Clicking the ‘Layers’ Aerial Imagery_Aerial_Imagery 2022Jan link yields a similarly disappointing documentation site, but that page does have a REST link which renders the page as json. Here’s an extract:
{
	"capabilities" : "Map,Query,Data",
	"copyrightText" : "",
	"defaultVisibility" : true,
	"description" : "",
	"extent" :
	{
		"spatialReference" :
		{
			"latestWkid" : 20482,
			"wkid" : 20482
		},
		"xmax" : 999.9775599999994,
		"xmin" : -64131.38244,
		"ymax" : -3705000,
		"ymin" : -3803650.64
	},
	"hasAttachments" : false,
	"id" : 0,
	"maxScale" : 0,
	"minScale" : 0,
	"name" : "Aerial Imagery_Aerial Imagery 2021Mar",
	"parentLayer" :
	{
		"id" : -1,
		"name" : ""
	},
	"subLayers" : null,
	"type" : "Raster Layer"
}
The above json suggests that we are able to query the data, and that there’s raster in there somewhere. But how?!
ESRI documentation suggests that I should be able to query this MapServer using a tiling scheme, like so MapServer/tile/{z}//{x}/{y}/, but when I try that, I get a 400 Error: Service not configured for tiling interface. So that’s a bit of a dead end.
There also isn’t any Query button on the layer page, so I can’t run any test queries.
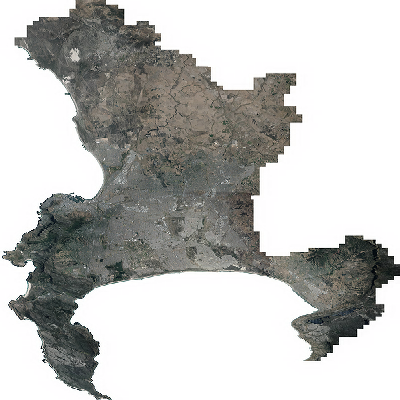
What to do? Well, if we look at the orignal MapServer documentation map, there is a button called Export Map. When we click it, we actually get a thumbnail of the map! But the results are somewhat underwhelming - it’s quite a low resoluiton image - and the page doesn’t show any way to alter the resolution or extent.
However, if we look at the URL of that image, it’s quite interesting:
That, dear readers, looks like a REST endpoint. And, if we tweak the parameters, lo and behold, we get different images!
For instance, if I tweak the bbox to just cover a 100m x 100m cell like in this link:
I get this image:

Nice, but the resolution is quite crappy. What does ESRI say about this? Well, here’s their documentation. It looks like we can pass the size parameter to specify the pixel height and width. We know this is 8cm per pixel imagery, and that each unit of extent is 1m, so for a 100m x 100m square of land we want to have at least 1250 x 1250 pixels for full resolution. To be safe, let’s double that to 2500. We append &size=2500,2500 to the last query:
Here’s the result:
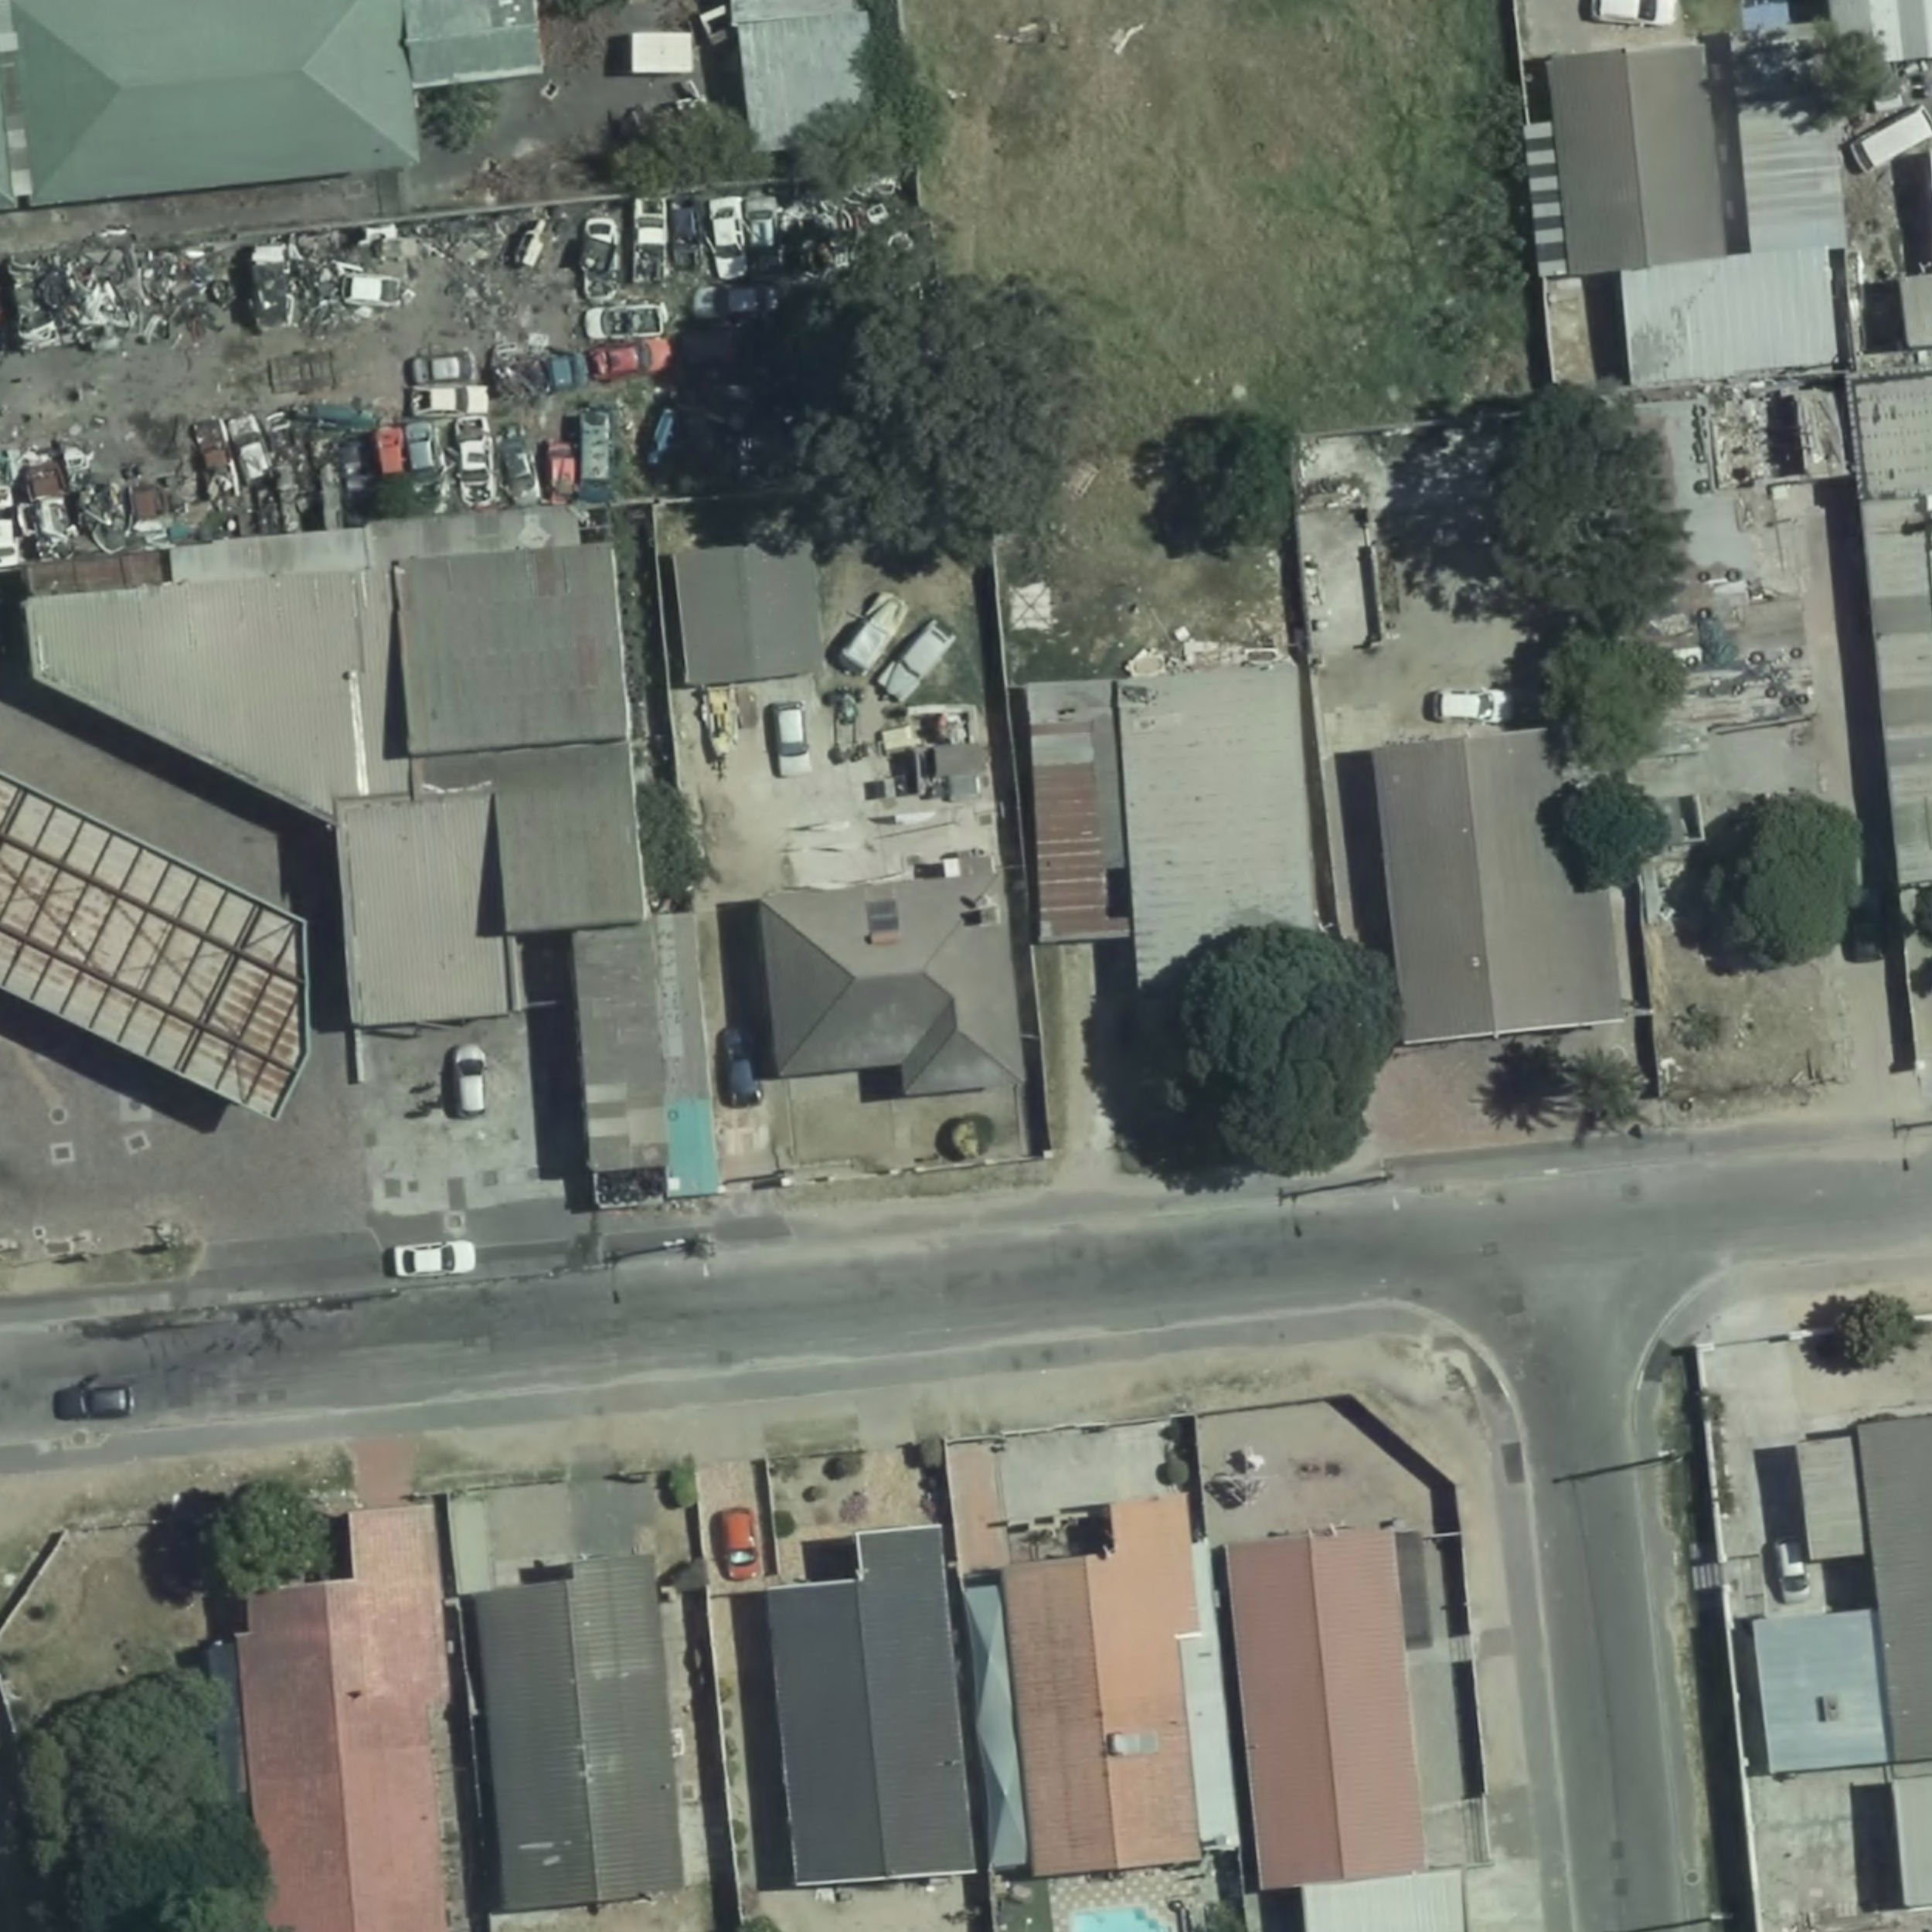
Lovely.
Scripting
Up until now, we’ve been messing around in the URL bar of a web browser. Let’s script this so we can download everything!
I’ll use python, but there’s no reason you can’t use another language. Bash seemed to work fine with wget and friends.
First, we want to import some libs
import random
import urllib.request
import os
import time
Then we want to define the max and min of the x and y axis of the dataset extent (we got these from the json above).
xmax=900
xmin=-64132
ymax=-3704900
ymin=-3803651
Let’s also specify the size of each cell we’ll cut the dataset into
image_dim_meters=100
# In case you want non-square images in the future
xwidth_meters=image_dim_meters
yheight_meters=image_dim_meters
Finally, let’s shuffle these ranges so that we start getting some interesting images from the outset (I like instant gratification). If you don’t do this, your first few tens of thousands of images will be blank because the City isn’t square. You can omit these lines if you want to proceed in a linear fashion.
xrange = list(range(xmin, xmax, image_dim_meters))
yrange = list(range(ymin, ymax, image_dim_meters))
random.shuffle(xrange)
random.shuffle(yrange)
Finally, let’s loop through our grid, one x-axis strip at a time, pulling and then saving the images to disk. Note that I’ve added a cache check function so that we don’t query for any images we already have, and that we add a 5 second pause to not be a nuisance to the server.
We save images with the following path scheme:
cct/{image_side_length_meters}/{xmin_coord}/{ymin_coord}/img.png
The path scheme allows us to idempotently run the script, and it allows us to reliably locate the image in space. We culd add other metadata about each image in the same directory, in, say, a ‘metadatafile. Or we could savejpegs` etc. The point is that the directory is the location for all the data about that particlar square of space.
for x in xrange:
  xmina=x
  xmaxa=xmina+image_dim_meters
  print("Strip:" + str(x))
  for y in yrange:
    time.sleep(5)
    ymina=y
    ymaxa=ymina+image_dim_meters
    fileURL = "cct/"+str(image_dim_meters)+"/"+str(xmina)+"/"+str(ymina) + "/img.png"
    fileExists=os.path.isfile(fileURL)
    if fileExists:
      print(fileURL + " exists. Skipping.")
    else:
      print(fileURL)
      print(os.path.dirname(fileURL))
      imgURL = "https://cityimg.capetown.gov.za/erdas-iws/esri/GeoSpatial%20Datasets/rest/services/Aerial%20Imagery_Aerial%20Imagery%202021Mar/MapServer/export?bbox="+str(xmaxa)+","+str(ymaxa)+","+str(xmina)+","+str(ymina)+"&size=2500,2500"
      os.makedirs(os.path.dirname(fileURL), exist_ok=True)
      urllib.request.urlretrieve(imgURL, fileURL)
      print(imgURL)
Et voila! If you check out your working directory, there should be a new subdirectory called cct that is slowly filling up with images.
Full script, for copypaste:
import random
import urllib.request
import os
import time

xmax=900
xmin=-64132
ymax=-3704900
ymin=-3803651
image_dim_meters=100
xwidth_meters=image_dim_meters
yheight_meters=image_dim_meters
xrange = list(range(xmin, xmax, image_dim_meters))
yrange = list(range(ymin, ymax, image_dim_meters))
random.shuffle(xrange)
random.shuffle(yrange)


for x in xrange:
  xmina=x
  xmaxa=xmina+image_dim_meters
  print("Strip:" + str(x))
  for y in yrange:
    time.sleep(5)
    ymina=y
    ymaxa=ymina+image_dim_meters
    fileURL = "cct/"+str(image_dim_meters)+"/"+str(xmina)+"/"+str(ymina) + "/img.png"
    fileExists=os.path.isfile(fileURL)
    if fileExists:
      print(fileURL + " exists. Skipping.")
    else:
      print(fileURL)
      print(os.path.dirname(fileURL))
      imgURL = "https://cityimg.capetown.gov.za/erdas-iws/esri/GeoSpatial%20Datasets/rest/services/Aerial%20Imagery_Aerial%20Imagery%202021Mar/MapServer/export?bbox="+str(xmaxa)+","+str(ymaxa)+","+str(xmina)+","+str(ymina)+"&size=2500,2500"
      os.makedirs(os.path.dirname(fileURL), exist_ok=True)
      urllib.request.urlretrieve(imgURL, fileURL)
      print(imgURL)
Now what?
Well we can use this imagery for all sorts of interesting stuff. Counting dwellings or trees, estimating farmland extent etc.
I want to write a little script that takes 12 random images from my cached cct directory, combines them into a grid, and sets my wallpaper each morning, so I can see a different bit of Cape Town each day. But that looks like it needs more than just base python so I’ll leave it for another day.